Introduction: Smarter Crop Monitoring with Agri Lens
Healthy crops are essential for productive and sustainable agriculture. However, farmers often identify plant stress only after visible symptoms such as yellowing leaves, reduced growth, wilting or changes in leaf colour appear.
A Crop Lens and Plant Health Scanner can help farmers, agronomists and agricultural researchers monitor changes in vegetation using optical measurements and plant health indicators.
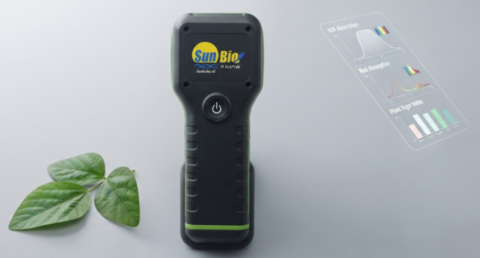
The SunBio Agri Lens is designed for rapid, non-destructive crop analysis. Depending on the model, it captures spectral information and calculates vegetation indices to help users assess plant vigour, greenness and potential crop stress.
By following a consistent leaf-scanning schedule, growers can compare results over time and investigate possible problems earlier.
1. What Is a Crop Lens?
A Crop Lens is an optical crop-monitoring tool that captures information from plant leaves and vegetation to help assess crop condition.
Rather than relying only on visual inspection, growers can collect repeatable readings and compare changes throughout the crop growth cycle.
Potential applications include:
- Monitoring leaf greenness and vegetation vigour.
- Comparing plant development across different areas of a field.
- Identifying unusual changes that may indicate crop stress.
- Supporting field scouting and nutrient-management investigations.
- Recording crop performance at different growth stages.
2. Plant Health Scanner: Monitor Crop Condition
A Plant Health Scanner helps farmers assess changes in plant condition through optical measurements and vegetation indices.
Healthy and stressed plants can reflect light differently because of changes in pigments, leaf structure and water status. These differences can provide useful information for crop monitoring.
With compatible Agri Lens models, users can evaluate indicators such as:
- NDVI: An indicator associated with green vegetation and plant vigour.
- GNDVI: A vegetation index useful for evaluating variations associated with chlorophyll and green vegetation.
- NDRE: A red-edge vegetation index useful for monitoring canopy condition and changes associated with chlorophyll, particularly in developed crops.
These indices are indicators, not standalone diagnoses. Their interpretation depends on the crop, growth stage, measurement conditions and supporting field observations.
3. Leaf Scanner: How Often Should You Scan Leaves?
Regular leaf scanning makes it easier to compare changes than taking a single measurement.
For many crops, a practical starting point is to scan representative plants every 7–10 days during active growth. A 20-day interval can be useful for a broader comparison when crop conditions are stable, but it may miss short-term changes.
Suggested leaf-scanning schedule
| Monitoring period | Suggested activity | Purpose |
|---|---|---|
| Day 1 | Record the initial leaf scan | Establish a baseline |
| Day 10 | Repeat the scan on the same plants or representative leaves | Compare changes in greenness and vegetation indices |
| Day 20 | Scan again and compare with Day 1 and Day 10 | Review the crop’s trend |
| Day 30 | Continue monitoring and record field observations | Evaluate longer-term changes |
Important: This is a suggested monitoring schedule, not a guarantee that a problem will be detected within a particular number of days. Scan more frequently when the crop is under stress or when an agronomist recommends it.
For reliable comparisons, use the same scanning method, consistent lighting or device settings, and similar leaf positions wherever possible.
4. NDVI vs GNDVI vs NDRE: Which Crop Scanner Is Best at Each Growth Stage?
Choosing the right vegetation index is important for effective crop monitoring. SunBio Agri Lens supports spectral analysis using vegetation indices such as NDVI, GNDVI and NDRE, depending on the selected model’s sensor capabilities.
Each index provides different information about crop growth, leaf greenness and plant health. Farmers can use these measurements to compare crop development over time and investigate potential plant stress.
NDVI, GNDVI and NDRE Crop Growth Monitoring Chart
| Approximate Crop Age | Recommended Scanner | Monitoring Objective |
|---|---|---|
| Day 1–10 | Baseline crop scan | Record initial plant development and establish a reference |
| Day 10–20 | NDVI Crop Scanner | Monitor early green vegetation and crop establishment when sufficient foliage is present |
| Day 20–40 | NDVI + GNDVI Scanner | Compare vegetation development and changes associated with leaf greenness |
| Day 40–60 | GNDVI + NDRE Scanner | Assess chlorophyll-related variation as the crop canopy develops |
| Day 60 onward | NDVI + GNDVI + NDRE | Compare vegetation vigour and chlorophyll-related indicators in established crops |
Note: These are illustrative monitoring periods, not fixed biological rules. Crop species, planting method, environmental conditions and growth stage affect when each index is most useful. For newly planted crops with sparse foliage, soil background can influence readings.
1. NDVI Scanner: Early Crop Growth Monitoring
The Normalized Difference Vegetation Index (NDVI) is commonly used to monitor green vegetation and crop vigour.
During early crop development, NDVI measurements can help establish a baseline and track changes as the plants develop more foliage.
Suggested monitoring: Begin with a baseline scan and compare readings around Days 10, 20 and 30, depending on crop development.
Applications:
- Monitoring early vegetation development.
- Comparing crop growth across field sections.
- Identifying areas that may require additional inspection.
- Tracking vegetation changes throughout the growing season.
NDVI readings can be less sensitive to further increases in vegetation in dense canopies, so additional indices may be useful as crops mature.
2. GNDVI Scanner: Leaf Greenness and Chlorophyll-Related Monitoring
The Green Normalized Difference Vegetation Index (GNDVI) uses green and near-infrared spectral information to assess differences associated with green vegetation and chlorophyll.
It can be useful during active vegetative growth when farmers want to compare changes in leaf greenness and investigate possible nutrient-related stress.
Suggested monitoring: Compare readings at approximately 10-day intervals during relevant growth stages, adjusting the schedule to the crop.
Applications:
- Comparing leaf greenness between plants.
- Monitoring vegetation changes over time.
- Supporting the investigation of possible nitrogen stress.
- Comparing crop sections with different growth patterns.
GNDVI does not directly measure nitrogen concentration. Other factors, including water stress and disease, can influence the readings. Confirm suspected nutrient deficiencies with appropriate agronomic assessment.
3. NDRE Scanner: Advanced Crop and Plant Health Monitoring
The Normalized Difference Red Edge Index (NDRE) uses red-edge and near-infrared spectral information. It is particularly useful for assessing chlorophyll-related differences in established crops with developed canopies.
As the canopy becomes dense, NDRE may reveal variations that NDVI does not clearly distinguish.
Suggested monitoring: Begin when the crop has developed sufficient foliage and the index is appropriate for that crop. Continue comparisons at consistent intervals, such as every 10 days.
Applications:
- Monitoring chlorophyll-related variation in developed crops.
- Comparing crop vigour across different field zones.
- Investigating potential nutrient stress.
- Tracking crop condition during mid-to-late growth stages.
NDRE requires a sensor with the appropriate spectral bands. Its usefulness depends on the crop, measurement conditions and interpretation method.
4. Plant Moisture Monitoring and Water-Stress Assessment
Plant water status is important for crop development. Optical measurements may help identify changes associated with water stress, but NDVI, GNDVI and NDRE are not direct measurements of leaf water content.
For a more complete assessment, combine Agri Lens readings with soil moisture measurements, irrigation records, rainfall, temperature and field observations. For automated irrigation strategies, pairing optical scans with a Smart Irrigation System can provide better farm management control.
Agri Lens readings should therefore be interpreted alongside relevant information such as:
- Soil moisture readings from a suitable soil moisture sensor.
- Irrigation schedules and recent rainfall.
- Ambient temperature and relative humidity.
- Visible wilting, leaf curling or other crop symptoms.
- Crop stage and field conditions.
Suggested moisture-monitoring schedule
| Period | Monitoring activity |
|---|---|
| Day 1 | Record the baseline leaf scan and soil moisture, if available |
| Day 5–7 | Review moisture conditions, particularly during hot or dry weather |
| Day 10 | Repeat the leaf scan and compare readings |
| Day 20 | Review longer-term trends and irrigation records |
Soil moisture should be checked more frequently when irrigation decisions depend on rapidly changing field conditions. Leaf scans alone should not determine irrigation requirements.
5. Plant Nitrogen Stress Monitoring
Nitrogen supports chlorophyll formation and healthy plant growth. Changes in leaf greenness and vegetation indices can help identify areas that warrant further investigation.
GNDVI and NDRE may provide useful supporting information when the sensor is suitable for the intended crop and measurement conditions.
Suggested nitrogen-monitoring schedule
| Period | Monitoring activity |
|---|---|
| Day 1 | Establish baseline readings for representative plants |
| Day 10 | Compare greenness and compatible vegetation indices |
| Day 20 | Review the trend and inspect areas showing unusual changes |
| Day 30 | Compare the results with crop growth, fertiliser records and agronomic observations |
Use crop-specific recommendations and, when needed, suitable leaf or soil testing before changing fertiliser application.
For nitrogen assessment, GNDVI and NDRE may provide useful supporting indicators when the selected device measures the necessary spectral bands and has been validated for the intended crop.
Do not diagnose nitrogen deficiency or prescribe fertiliser from an index alone.
6. Is Agri Lens a Plant Age Scanner?
Agri Lens can support crop growth monitoring by recording optical measurements at different stages of plant development. However, NDVI, GNDVI and NDRE do not directly calculate the exact age of a plant.
For reliable crop-age tracking, record the sowing or transplanting date, crop variety and growth stage alongside each scan. Comparing successive measurements helps users understand how the crop is developing.
7. Why Choose SunBio Agri Lens?
SunBio Agri Lens supports non-destructive plant analysis, allowing growers and researchers to collect readings without removing or damaging leaves.
Depending on the selected model, the Agri Lens series offers:
- Rapid optical scanning.
- Portable field use.
- Android application connectivity.
- Vegetation-index analysis.
- Support for repeat measurements and crop comparisons.
- Advanced spectral analysis for selected research applications.
The Basic, Pro and Pro+ models offer different spectral capabilities. Select the appropriate model according to the crop-monitoring indicators and research requirements.
8. Practical Tips for Reliable Leaf Scanning
- Select representative plants from different areas of the field.
- Record the crop type, variety, growth stage and scan date.
- Use consistent measurement conditions and leaf positions.
- Compare results with previous readings rather than relying on a single scan.
- Record rainfall, irrigation, fertiliser application and visible symptoms.
- Investigate unusual results with suitable field checks or laboratory testing.
- Maintain a monitoring log throughout the growing season.
Frequently Asked Questions (FAQs)
What is the main purpose of a Crop Lens and Plant Health Scanner?
A Crop Lens captures spectral data and vegetation indices (such as NDVI, GNDVI, and NDRE) to help growers monitor plant greenness, assess crop vigour, and detect early signs of stress before visible symptoms appear.
How often should leaves be scanned using Agri Lens?
A practical starting point during active crop growth is scanning representative plants every 7 to 10 days, with 20-day intervals useful for longer-term comparisons when conditions are stable.
Can Agri Lens directly diagnose nitrogen deficiency or water stress?
No. Vegetation indices serve as supporting indicators rather than standalone diagnoses. They should always be paired with soil moisture data, weather records, and agronomic field inspections.
Conclusion
Crop Lens technology, plant health scanning and regular leaf monitoring can help farmers make more informed decisions about crop condition and potential stress.
A structured 10-day scanning routine, supported by a 20-day comparison, provides a practical starting point for observing crop trends. Additional moisture and nutrient measurements help put optical readings into context.
SunBio Agri Lens brings rapid optical analysis and vegetation monitoring together to support precision agriculture, crop research and data-driven farm management.
Explore SunBio Agri Lens: https://www.sunbioit.com/agri-lens
Interested in smart agriculture solutions? Contact SunBio IT Solutions to discuss your crop-monitoring and agricultural technology requirements.
Leave a Reply